museum of london docklands exterior view; 2010
New Museum of London Smart Building prototype

The Museum of London (MoL) has embarked on an extraordinary journey to create a new museum for London (UK). This is a once-in-a-generation opportunity to reconceive what a museum for London can be and deliver the best City Museum in the world. Accordingly, we are designing the new museum as a smart building. To inform the design, implementation and operational use of the smart museum, we created a smart building prototype at one of our other museum properties and an additional office and storage facility — these are the Museum of London Docklands and Mortimer Wheeler House. This case study refers to this prototype.

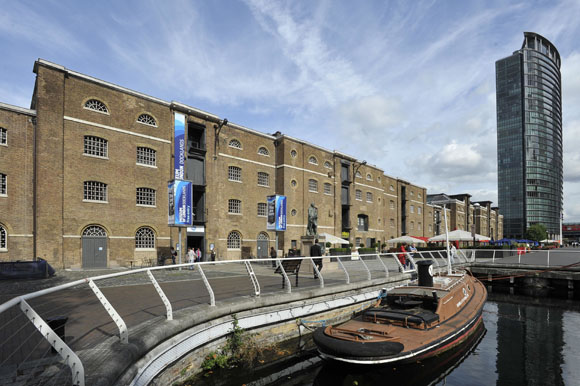
The Museum of London is a public institution that collects, preserves and displays the history and culture of London from prehistoric times to the present. MoL currently manages and operates three buildings located in the Greater London Area: (1) the Museum of London Docklands, a 200-year-old warehouse close to the river Thames in Canary Wharf; (2) the Mortimer Wheeler House, the largest archaeological archive in the world; and (3) the Museum of London Wall, which closed in December 2022 to prepare for the move to a new smart Museum of London at West Smithfield, opening in 2026. Since 2020, the existing museums have been part of a major digital transformation project that aims to inform the development of the new smart museum at Smithfield, enabling MoL to evaluate energy, carbon, building performance and efficiencies across the entire portfolio, including the connectivity of the buildings with the grid.

Project Information

Location

London, United Kingdom

Building Typology

Museum

Technology Installed / Proposed

The technology installed is to capture system data from the building management system (BMS) and the energy meters. The BMS is Trend 963. We used Tridium Jace devices and Tridium Niagara to collect and manage the data. We use Influx-DB as our time series database and a mosquito MQTT broker.

DATA AVAILABILITY

Data are confidential.

Status

Operational - Awaiting Results

This project started from a desire to build a small prototype, get hands-on involvement and practical experience at a small manageable scale, and to gather learnings to feed into the design of the new Museum of London. When this project was started, the new museum design was already at RIBA Plan of Work stage 3 (i.e. spatial coordination) and in 2020 it was not designed as a smart museum. This changed between RIBA stage 3 and 4 (i.e. technical design completed) and so some of the thinking and planning had already begun. The asset naming convention, for example, had already been decided on the Smithfield project and so it was possible to apply and test this in the prototype to confirm its suitability in the real-world application.

We aimed to build a prototype and experience some of the design and implementation errors in a safe, less critical environment. Further, we wanted the system to work as a pilot, so that we could test the user interface and impact on the facility management team. Then, feedback and learnings could be gathered and fed into future decision making. Additionally, we wanted to engage with the smart building market, the master system integrators and other vendors, to understand the businesses in London operating in this field.

The motivation for the project is to make a significant difference in the way buildings are managed and operated. The aim is to use data to expose accurate understanding of the status of building performance and thereby using a shared understanding (amongst all involved in the building management and operation) to drive improvements across the client team and contractors working in the fields.

The project employs a variety of technologies to create an integrated smart building system. It utilises Trend’s 963 as a building management system and Tridium’s Jace and Niagara platforms for seamless building management and control, alongside the Mosquito Broker for efficient IoT messaging. The OnPoint software enhances user interaction with the building’s systems, providing a clear and intuitive interface. A LoRaWan network supports connectivity for 12 battery-operated IoT sensors, gathering crucial environmental data. To ensure consistency and interoperability, the project adopts building device naming standards (BDNS) for asset naming; aligns data models through initiatives such as the Buildings IoT ontology alignment project (OAP); employs Haystack tagging for semantic consistency; and uses Grafana for advanced data visualization. Infrastructure-wise, the system runs on two virtual machines hosted on existing on-site servers: one MS Windows machine for Niagara 4 and one Unix machine for the Influx DB, optimising resource use and data management in the smart building ecosystem.

The business model is expected to be in the install and then maintenance cost. But there also needs to be a process/service/software that provides governance to make sure that the data is of good quality and monitors and reports on any changes. Any changes will then need to be correctly assimilated into the smart building work.

In the initial state, when the data were being viewed via Grafana, it required some specific skills to be able to identify the right data and to create the graphs. Although this was achieved, it was probably mostly due to the commitment of the facility manager (FM) at the time, John Iaciofano. Then, once we connected OnPoint, it was much easier to interface with the data via their software. Their floor plan visualisations also make it easy for the FM team to view live conditions. For fault finding, it is invaluable. It provides a go-to source of historical data that we now use for all fault analysis. Being able to set up dashboards for specific faults or to watch specific assets performance is very useful. The decision to move to OnPoint was largely driven by the software’s ability to provide insights into the building performance, which Grafana was not able to provide.

In the past, there was no easy client management access to the data. Access to the data was typically through different systems (the BMS and then the meters interface), which was awkward. Also, we have never before had a time series data set of all our BMS and meter data in the one location. Previously I would estimate that 90% of the BMS data was lost.


From a data perspective, the benefit of this project is huge, in that we now have all BMS historical and live data available without needing to know how to operate the Trend BMS.

From a final solution perspective (i.e. fault found to fault fixed), there is still work to be undertaken regarding user training, user involvement and change management to enable the full use of the system. This work is currently ongoing and the results will need time to be assessed.

It was always known that just providing a technological or software solution would not be enough to go from Fault to Fixed. The development of the application programming interface (API) to transfer OnPoint insights to the computer-aided facility management (CAFM)/ computerized maintenance management system (CMMS) is the newest route that we are investigating to deliver the FFD information to the engineers.

I cannot see any problems with scalability. We are currently designing exactly the same smart building infrastructure for the much larger scale new Museum of London.

Data management:
Good clear governance of the building data sets is crucial to trust the data you are basing your decisions on.

The naming of the data (assets and points) needs to be carefully thought through and includes the impact of renaming on the existing building services conventions.


Users’ acceptance:
Occupant acceptance needs skilful attention. You need to build the system with the converted first. Building it against resistance would be very difficult.


Computational requirements and complexity:
Getting the BMS all over onto IP controllers was an initial hurdle. Also, our prototype could have only been possible with the help of our Head of IT, who coordinated the IP network access for installation and operation.

We had some early issues when patches were applied to the network machines and our Niagara 4 supervisor was not restarting.

There are two buildings in the project. One is the public-facing Museum of London Docklands and the other is the storage and research facility Mortimer Wheeler House, which is used by the Museum of London Archaeology (MOLA) organisation.

The Museum of Docklands is open to the public 7 days a week. It provides visitors with access to a permanent collection and temporary exhibitions. Additionally, it houses the staff required to run this museum, including security and a site-dedicated facility management team of staff, contractors and sub-contractors who maintain and operate the building. In areas where artwork or collection material is displayed or stored, there is strict requirements to achieve temperature and humidity control within specified ranges. Energy data is collected from meters and accessed via the Building Management Systems (BMS).

Initially the data were collected and then analysed via the data visualisation interface Grafana. This enabled us to build graphs and other visualisations of the datastreams in a better interface than the one that was available via the BMS. This data visualisation was used primarily for analysis of HVAC equipment performance, fault detection and diagnostics (FDD), and energy consumption analysis. As the prototype matured, we moved away from Grafana to OnPoint as our data visualisation interface.

The project leverages data from BMSs, electrical meters, and internet of things (IoT) sensors. These sources emit data using various protocols, including building automation and control networks (BACnet), low power wide area networking (LoRaWan) and MQTT, each adhering to its own naming conventions. This diversity created significant interoperability challenges, impacting both device communication and the semantic interpretation of data. In particular, within the framework of Trend’s BMS, a series of field controllers are deployed to gather data from sensors and enact control measures for environmental regulation. Initially, many of these controllers were not connected to the building’s IP network, and thus required substantial effort to integrate them. Furthermore, considerable effort was made to rename the various points in order to conform with a unified naming convention, following the BDNS standard (i.e. building device and asset naming standards).

For more information on the Case Study

Contact Person: 

Steve Watson

cc by nc nd
Copyright Statement
Fraunhofer IEE agree that the case study information of ZUB Building can be shared under CC BY-NC-ND 4.0 license. This license allows others to download your works and share them with others as long as they credit you, but they can’t change them in any way or use them commercially.

Contact Researcher