polite pv1 1024x574
PoliTo Campus (Photovoltaic Plant)

The case study examines the photovoltaic energy production of seven plants at the Politecnico di Torino (PoliTo) campus, an Italian university located in the Piedmont region. Over the years, the campus has undergone various expansions, including the recent conversion of an industrial hub into classrooms and the addition of new buildings for research centres and laboratories. To meet the increasing electricity demand of these buildings, seven photovoltaic plants have been installed across different locations on campus.

These photovoltaic plants were installed over several years, each with varying installed capacities, array configurations and monitoring infrastructures. At the time of writing (2024) the total installed photovoltaic capacity had reached nearly 1 MW. Given the size of the plants and their significant impact on the campus’s energy expenditure, a continuous energy monitoring system and an anomaly detection tool have been implemented. This system facilitates photovoltaic load forecasting and estimation and provides real-time alerts in the event of malfunctions or suboptimal performance at the site.

Project Information

Location

Turin, Italy

Building Typology

Education Building

Technology Installed / Proposed

Scaling up an energy information system application for anomaly detection on seven photovoltaic plants; implementation and testing of continuous monitoring platform and a real time alerting tool.

DATA AVAILABILITY

High-resolution data related to seven photovoltaic (PV) plant and relative semantic metadata model. Data related to solar irradiance, voltage, current and power meters installed on the inverters with 1-minute resolution from 2014 onwards. Please, contact the authors for data availability.

Status

Testing/ Commissioning

Increasing awareness of energy systems operations and reducing energy waste related to incorrect and faulty operation is essential for an effective energy management strategy, especially in non-commercial and complex buildings. However, the large volume of collected data, unconventional data acquisition methods, and inefficient data storage and retrieval strategies can result in inefficient data extraction and utilisation. Advanced data analytics tasks require a formal data representation as well as a simple and logical method of transmitting feedback to end users to increase the adoption of such energy management tools. The objective of this case study is to demonstrate how advanced data analytics techniques for electrical load forecasting, a robust data acquisition pipeline, a structured metadata representation and a modern micro-services infrastructure can make data exploitation scalable and actionable for end users.

This is a field demonstration project aiming at deploying and validating the effectiveness of a real-time anomaly detection strategy and testing its ability to promptly identify and communicate with operations and maintenance (O&M) staff. The methodology has been developed to be portable among different case studies with only a few commonly monitored variables (e.g., electrical power output from the PV inverter and global solar irradiance). Business models may include a software-as-a-service (SaaS) model or an annual contract for the service. Integration of an application programming interface (API) with existing building automation systems (BAS) from installed vendors is also possible.

The described technology was tested throughout 2023 and is now in the commissioning phase. The platform has been used by the PoliTo maintenance staff and has successfully detected several anomalies, such as broken sensors, missing data logger transmissions and PV faults, prompting maintenance actions on the PV plants.

During the transition from testing to commissioning, several trade-offs were made to ensure the tool is easily usable and interpretable by end users. Basic training was provided to maintenance staff during onboarding to familiarise them with the tool. To enhance accessibility, the tool features a clear and interactive visualisation interface, which has been well-received by end users. This user-friendly design not only highlights the tool’s usefulness but also increases the staff’s willingness to use it on a regular basis.

The anomaly detection tool has been proven to be effective at identifying problems with photovoltaic systems in real time, which can help to minimise downtime and increase operation efficiency. Initial testing of the tool has been promising in detecting malfunctions, but further work is needed to optimise the model through the selection of appropriate training data and tuning hyperparameters. Moreover, additional work is required to improve the design of the tool, such that it is as non-invasive as possible for end users by sending alerting messages only when really needed.

Thanks to the adoption of the Brick ontology schema and related semantic technologies, it was possible to develop a completely agnostic and scalable machine learning pipeline that could be easily deployed across all the photovoltaic plants in the PoliTO campus. Transferability of the model was not tested, as separate models were created for each plant. Further investigation will be needed to determine if a single, more general model would be more advantageous than using different models for each plant.

There are several challenges that have been addressed in the deployment of a real-time data-driven model for photovoltaic prediction. Lessons learned and possible solutions mainly concerned data availability and quality.


Data collection, sensing and monitoring/ Data quality/ Data management:
Accurate and reliable data are crucial for training and evaluating a prediction model. However, meter-level measurements may be of poor quality, which can negatively impact model performance. Thanks to modern data acquisition protocols (MQTT, MODBUS and SFTP), redundant data acquisition strategy (two redundant servers and databases) and installation of highly performant hardware (e.g., GH Solution M502 dataloggers), high data quality is achieved for this case study. The percentage of missing values and data loss due to communication errors is very low (below 0.5% in the timeframe 2019-2023). Despite occasional lack of connection, the percentage of missing values in the dataset has been drastically reduced by an online automatic strategy that performs a series of pre-processing tasks directly on the timeseries database. This includes: consistency checks; threshold data cleaning; and possibly data reconstruction using linear interpolation methods and seasonal decomposition, depending on the nature of the variable and number of consecutive missing values.

The entire IT infrastructure has been deployed on the PoliTo campus open-source cloud service based on Kubernetes technology.

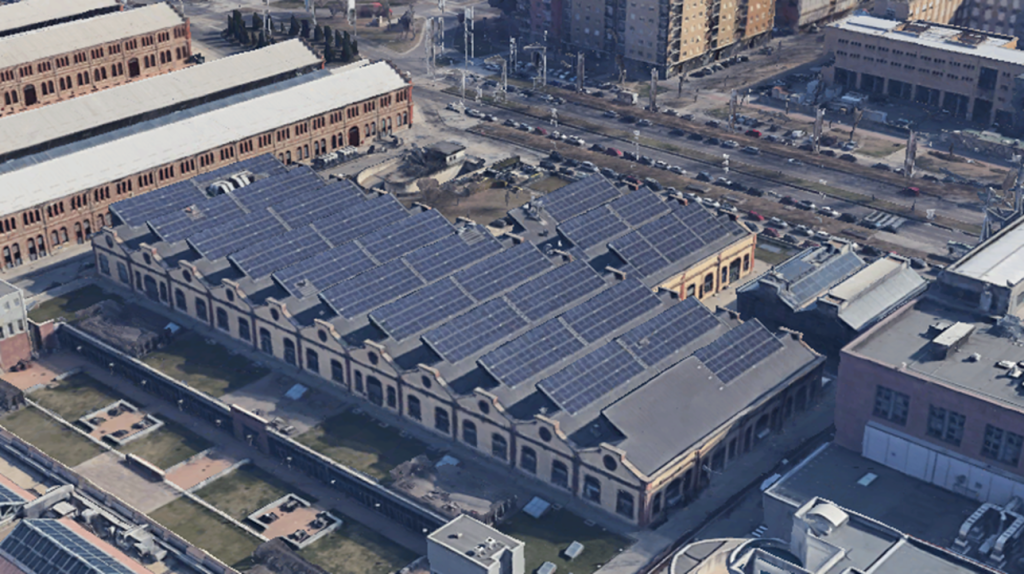
Each campus photovoltaic plant differs in installed capacity, array configurations and monitoring infrastructure. For example, the “Cittadella” plant, which has the highest installed capacity at 600 kWp, is equipped with an electrical power sensor, a global irradiance sensor and a temperature sensor located on the roof near the inverter. By contrast, other plants such as “DIATI” (183 kWp) and “Aule P” (50 kWp) only have electrical power output sensors. To capture this heterogeneity of system configurations, the entire campus photovoltaic plants and monitoring infrastructure have been described using the Brick schema in a metadata model. This way, the logical and physical relationships are encoded in a standard and machine-readable way, allowing the automatic query of the datapoints needed for the analysis. Each photovoltaic plant is equipped with a data logger that samples, processes and stores data in a time-series database at 1-minute resolution. The time-series database was designed to support efficient data storage and retrieval of time-series data.

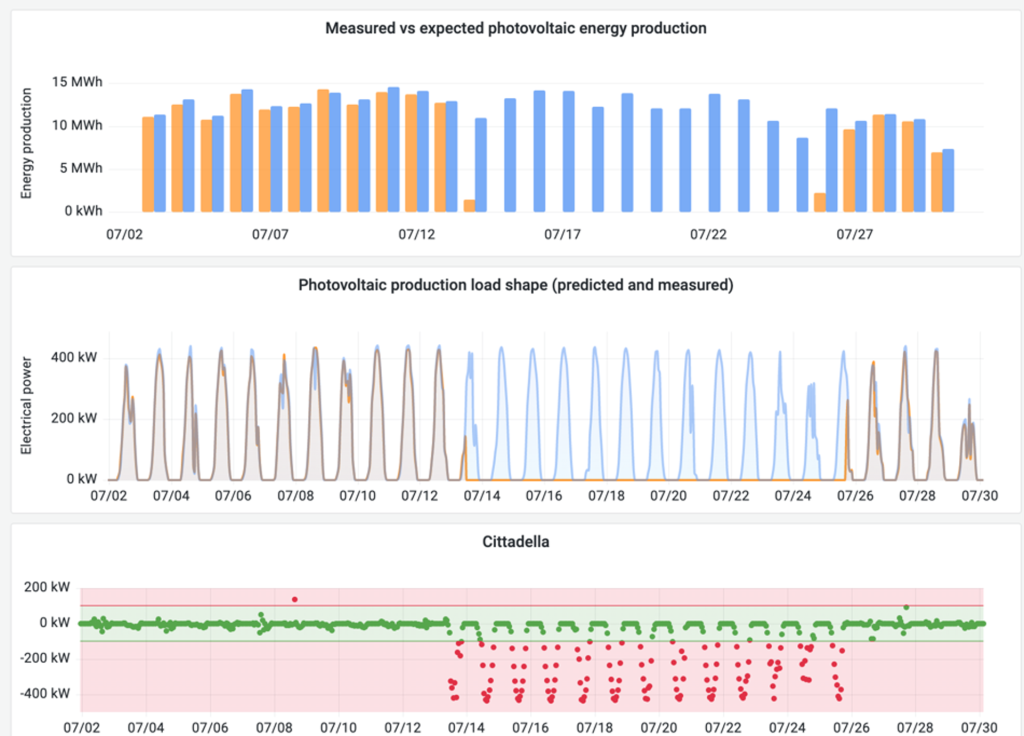
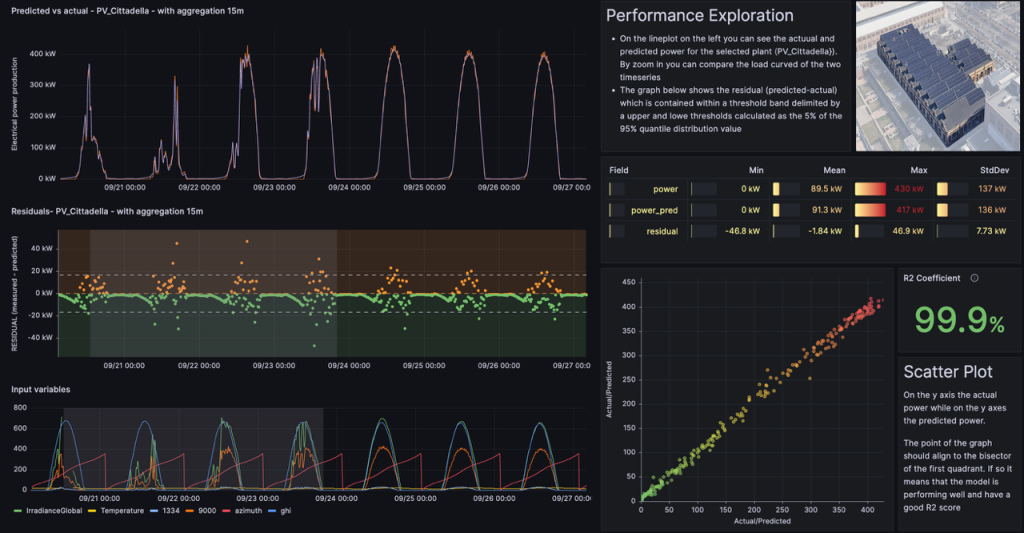
The algorithm leverages LSTM (Long Short-Term Memory) artificial neural networks to predict total electrical power production using external predictive variables such as zenith and azimuth angles, external air temperature and global horizontal irradiance.

The application can automatically assess if the metadata requirements (e.g., presence of a temperature sensor on the PV plant) are met by utilising the Brick metadata model of the PV plants. Additionally, the application is flexible enough to adapt to slightly different system configurations, accommodate missing sensors and remain agnostic to the naming conventions used for variables. For example, if a solar irradiance sensor is missing from a PV array, the application can substitute this variable with data from the campus weather station’s solar irradiance sensor without interrupting execution or causing compatibility issues.

The development process for the anomaly detection algorithm was designed to be portable and scalable, allowing the methodological framework used for a single PV plant to be easily applied to other plants with minimal reconfiguration. Consequently, a machine-learning pipeline was deployed for all seven PV plants following two approaches. The initial setup involved training separate models for each plant using 12 months data from 2023 (from January to December) and testing with 1-month worth of data from January 2024. These models were then deployed via Docker containers: for every incoming measurement the models estimate the expected photovoltaic production, calculating residuals and performing threshold analysis to identify possible malfunctioning. To keep the models up-to-date, monthly retraining is performed the first day of the month by means of a 6-month sliding window (i.e. each 1st of the month the previous 6 months data are considered), ensuring they reflect recent data and disregard older data that may correspond to previous system configurations (e.g., post-maintenance or cleaning performance changes).

Forecast results are available to end users through a visualisation frontend, and alerts with possible maintenance suggestions are communicated via email notifications.

R. Chiosa, M.S. Piscitelli, A. Capozzoli. (2021). A Data Analytics-Based Energy Information System (EIS) Tool to Perform Meter-Level Anomaly Detection and Diagnosis in Buildings. Energies, 14, 237. https://doi.org/10.3390/en14010237

M.S. Piscitelli, S. Brandi, A. Capozzoli, F. Xiao. (2021). A data analytics-based tool for the detection and diagnosis of anomalous daily energy patterns in buildings. Building Simulation, 14, 131–147. https://doi.org/10.1007/s12273-020-0650-1

A. Capozzoli, M.S. Piscitelli, S. Brandi. (2017). Mining typical load profiles in buildings to support energy management in the smart city context. Energy Procedia, 134, 865-874. https://doi.org/10.1016/j.egypro.2017.09.545

For more information on the Case Study

Contact Person: 

Roberto Chiosa

cc by nc nd
Copyright Statement
Fraunhofer IEE agree that the case study information of ZUB Building can be shared under CC BY-NC-ND 4.0 license. This license allows others to download your works and share them with others as long as they credit you, but they can’t change them in any way or use them commercially.

Contact Researcher