ev building high resolution 1024x683
EV Building, Concordia University

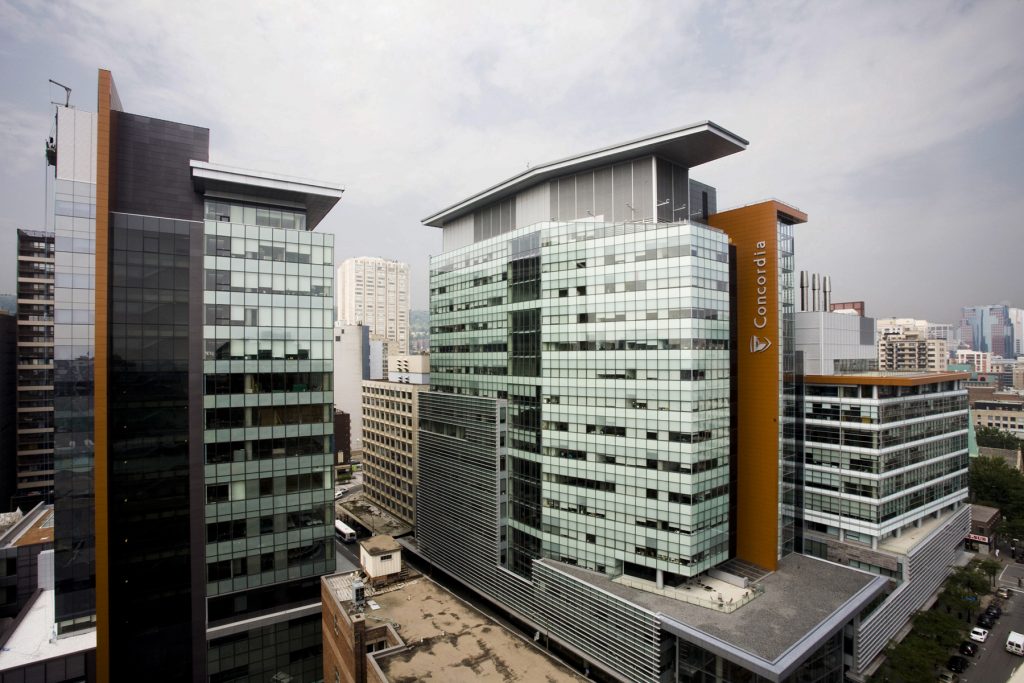
This building is in one of the city’s main intersections (Saint-Catherine St and Guy St), exposed to a large population moving around and through the building. It has two parts: the Engineering Computer science (ENCS) building and the Visual Art (VA). They are connected but have different heights and usage.

The ENCS tower has 16 floors above the ground surface, including offices, conference rooms and some mechanical and chemical laboratories on the 12th – 16th floors. Each of the three floors has a unique atrium. On the 17th floor, there is a mechanical room divided into five rooms plus one electrical room. Two underground levels connect to the metro station, underground restaurants and a tunnel connecting to the library building and Hall building.

The VA tower also has some offices and workshops. It has 11 floors above the ground, with one floor dedicated to a mechanical room on the 12th floor. The gross floor area of the EV building is 69,204 m².

Project Information

Location

Montreal downtown, Quebec, Canada

Building Typology

Education Building

Technology Installed / Proposed

Data-driven model from a wide range of installed sensors to generate occupant-related profiles to simulate thermal and electricity demands for decision making.

DATA AVAILABILITY

Building-related and energy-related data from temperature, movement and equipment sensors.

Status

Operational - Results Available

The project’s main aim is to generate occupant-related schedules stochastically and simulate the associated energy demand to inform building energy modelling. To implement this methodology, a data-driven model is proposed to generate the occupant-related profiles using a database made available by Concordia University facility management. The outcome of this study provides a more realistic simulated thermal and electricity demand for decision-making.

In the EV building, a standardised Siemens building management system (BMS) is installed to collects different datastreams. Different sensors have been installed in the building energy management system to collect energy-related information. The installed sensors and measurements include internal temperature sensors for each zone/room; movement sensors for each zone/room; flow rate measurement for air and water; valve status indicator for open/ closed/ percentage value; ON/OFF status indicator for boilers, heat pumps, fans, pumps; air quality measurement for CO2 and  CO; emergency light and alarms ON/OFF status indicator and energy consumption measurement (in kWh); fuel (Natural Gas) valve status and flow rate measurement; pipe pressure measurement; temperature measurement for water in pipes and inlets and outlets of heat exchanger; air handling unit operational status; external temperature measurement; solar PV energy output; Battery State-of-Charge (SOC) measurement; building-level electricity consumption measurement.

The developed model is supposed to be part of the CERC (Canada Excellence Research Chair) platform, an open-source urban energy modelling tool. Also, a graphical user interface (GUI) would be designed to illustrate different components of the methodology (e.g., data pre-processing, data-driven schedules) and results (i.e. generated occupant-related stochastic schedules and associated energy demand).

The collected sensor data in this building create the opportunity to develop different data-driven models to improve the accuracy and quality of decision-making for the facility management. Also, it enhances how organisations learn about their surroundings and respond to the changes. The developed model provides more realistic peak demands that enable the facility manager to actively control the system. For example, predicting the peak loads of the electrical appliances in an office building paves the way to implement peak shifting and reduces the related costs of the electricity fee of commercial buildings.

In the absence of sensor technology, collecting the specific data and developing the data-driven and high-accuracy models is not feasible. Sensors’ network makes an easily scalable solution for conducting system surveillance.

The benefits gained from data collection in this building are the possibility of developing energy-related data-driven models to improve the system control (e.g., HVAC, electricity use) and operational decision-making. So far, despite several installed sensors, there is still a lack of direct occupancy data collection due to privacy issues. However, facility management has been collecting the occupancy data using movement sensors since last year and saved in a repository. The main problem regarding this data is the lack of occupants in the space.

The developed methodology has the potential to be scaled up not only to all campus buildings but also to all buildings of Montreal and other cities.

Governance, compliance and legal oversight:
The unsolved issue in this project is the collection of occupancy data (count) due to privacy issues.


Data collection, sensing and monitoring/ Modelling and simulations:
Delays in sensor installation.

Lack of sub-metering for some of the operations (e.g., lighting as a separate operation) may have repercussions on energy modelling and simulation.

For the implementation of an energy simulation with lower uncertainty: detailed information about occupancy and their interaction with the energy system is crucial; sub-metering is also necessary to improve the simulation results; more realistic occupant-related schedules to each thermal zone facilitate the building energy management system; the complexity of the geometry and the mixed-use nature of the building also added critical challenges.

Developments for the occupant-related data-driven model included:

  1. Geometry and non-geometry attributes, weather data, energy system characteristics, and some of the operation schedules were collected to model the building performance.
  2. Data pre-processing entailed (1) data cleaning (the missing values of the electricity loads were filled in with the average of two previous values); (2) resolving inconsistencies; (3) data transformation by normalisation and aggregation. A few features were calculated (e.g., specific electricity power usage) and added to the prepared data frame. Due to the need for occupancy modelling, temporal features (e.g., day, month, weekday/weekend) were added.
  3. Data understanding using statistical analysis and visualisation. For example, the daily, monthly and seasonal profiles (in actual and normalised formats) were visualised. After data visualisation, possible influencing factors were identified in the dataset.
  4. Development of a data-driven model using the clustering technique (k-means method) to extract the occupant-related patterns and schedules on an hourly scale. This could help the facility management to actively control the operation schedules.
  5. Proposal of a stochastic occupancy model to generate the profiles for simulation and building management purposes.
  6. Implementation of the building energy simulation. The Insel4Cities platform with EnergyPlus engine has been used in the simulation.

For more information on the Case Study

Contact Person: 

Dr Sanam Dabirian

cc by nc nd
Copyright Statement
Fraunhofer IEE agree that the case study information of ZUB Building can be shared under CC BY-NC-ND 4.0 license. This license allows others to download your works and share them with others as long as they credit you, but they can’t change them in any way or use them commercially.

Contact Researcher