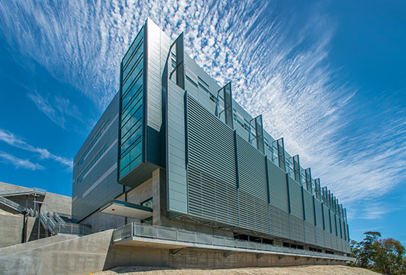
The LBNL Office Building (i.e. Building 59 or Wang Hall) is a medium-sized office building located inside the Lawrence Berkeley National Laboratory (Berkeley Lab) campus in Berkeley, California. The building has 10,400 m2 of conditioned spaces on four floors. The lower level provides space for mechanical systems, the second level is the National Energy Research Scientific Computing Center (NERSC), and the third and fourth levels are office spaces. The ground office floor (third floor) is primarily closed office space, while the second office floor (fourth floor) is primarily open office space. The building was built in 2015 and retrofitted in 2019 to improve its energy efficiency. Model predictive control (MPC) technology was implemented in the building automation system (BAS) to optimize HVAC operations (supply air temperature setpoint, air damper position, fan speed, hot water valve position) for saving energy.
Project Information
Location
Berkeley, California, USA
Building Typology
Office Building
Technology Installed / Proposed
Digital twin: building performance dataset and related metadata semantic models, model predictive control, occupant measurement.
DATA AVAILABILITY
High-resolution three-year time-interval data from more than 300 sensors and meters including whole-building and end-use energy consumption, HVAC system operating conditions, indoor and outdoor environmental parameters, as well as occupant counts and Wi-Fi connection counts.
Status
Operational - Results Available
PROJECT AIM
Reducing energy waste in buildings and optimising building operations require access to a diverse and integrated set of data. However, it is currently time consuming and hard to find datasets that have adequate data coverage, good data quality and clear documentation. Measuring ground truth at high resolution in all buildings is impractical and challenging. Therefore, it is critical to collect, curate and make publicly available high-resolution data from a small number of buildings that have broad applicability to a variety of high-impact use cases.
The building has rich sensing and monitoring systems, which provide data for implementing and testing MPC to validate its performance against the baseline rule-based controls. The data was curated and published to support public research on building energy and controls.
The uniqueness of this dataset includes:
- A rich high-resolution three-year time-interval data of a real office building, which includes two years of pre-pandemic data, and the year 2020 when the COVID-19 pandemic started.
- The building was used for model predictive control research and field testing.
- The dataset has camera-based occupant count measurements as well as proxy virtual sensing from the Wi-Fi-connected devices.
- A metadata semantic model based on the Brick schema, an open-source effort to standardize semantic descriptions of the physical, logical, and virtual assets in buildings and the relationships between them was developed to represent the metadata of the sensors, meters, and HVAC systems.
- A semantic description of the dataset (including building and system characteristics, and information on data curation, data quality, data categories, and application aspects) was developed.
BUSINESS PROPOSITION / MODEL
This is a field demonstration project to deploy and validate the energy savings of MPC technology. To scale up MPC deployments, business models include all four options (e.g., annual contract for service, software as a service, at-risk with shared savings, install only).
VALUE PROPOSITION
Building 59 is an all-electric building. The energy use intensity (EUI) of the two office floors was calculated for the three years and compared with other office buildings in the state of California using the Building Performance Database. Building 59 is an energy-efficient building. The EUI of 2018 is higher than that in 2019 and 2020, which is due to the building retrofit for improving the building efficiency in 2019. The MPC was implemented and ran well and achieved significant energy savings.
IMPACTS
The MPC was successfully implemented and run in Building 59 and various control strategies (focusing on energy use, utility costs or greenhouse gas emissions) were tested. MPC achieved 40% HVAC energy savings compared with the baseline rule-based controls. Most savings came from the reduction of supply airflow (thus fan energy) and the associated heating energy use.
The dataset can be used to support various use cases, including:
- Building energy benchmarking at the whole-building and end-use levels to understand relative energy efficiency compared with peer buildings (same use type, same climate zone) and improvement opportunities to reduce energy use.
- Load shape analysis to understand whole-building and end-use level demand profiles.
- Building energy prediction using statistical or machine learning algorithms.
- Occupancy analytics to understand occupancy patterns and the correlation between occupancy level and building energy use.
- Development and validation of building thermal simulation models for use in model predictive control.
- Fault detection and diagnostics to identify HVAC operational issues.
- Prediction and validation of occupant count using Wi-Fi connected device count.
LESSONS LEARNED
Implications of the Covid-19 pandemic:
Unintended consequences: In 2020, an unprecedented global lockdown was enforced to control the spread of COVID-19 in many countries. The impact of the pandemic lockdown on building energy use is complicated due to different building types, climate conditions, and control and operating policies. The restriction on occupants’ activities tended to reduce energy consumption in office buildings, particularly in electric devices such as lighting and plug loads.
However, the lingering effects of the lockdown may hamper the goal of improving building energy efficiency by adding uncertainty and additional requirements to minimise the spread of the virus. A comparison between the load shape of a typical summer day before (August 5, 2019) and during (August 3, 2020) the pandemic was conducted. The comparison of HVAC load shape before and during the pandemic shows that HVAC consumed more energy during the pandemic, both during day and night, which is due to the higher requirement of ventilation air and the associated heating energy because of the cool climate in the San Francisco area.
Users’ comfort:
The implementation of MPC marginally improved occupant thermal comfort.
Data management:
As the data came from a dozen sources with their own platforms, it is a huge effort to integrate these data and maintain data continuity and quality.
IMPLEMENTATION
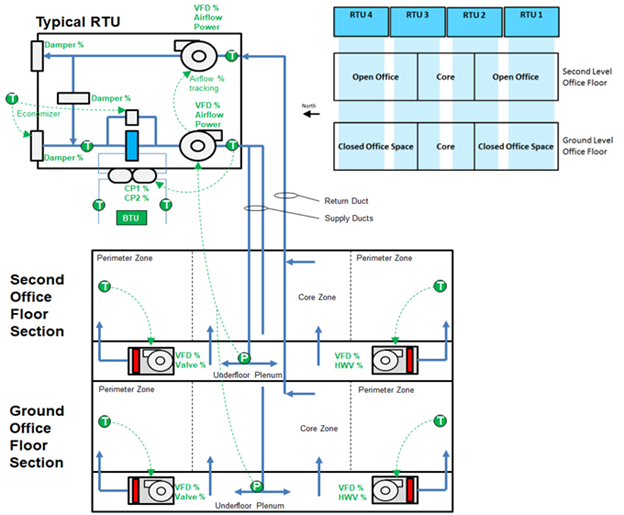
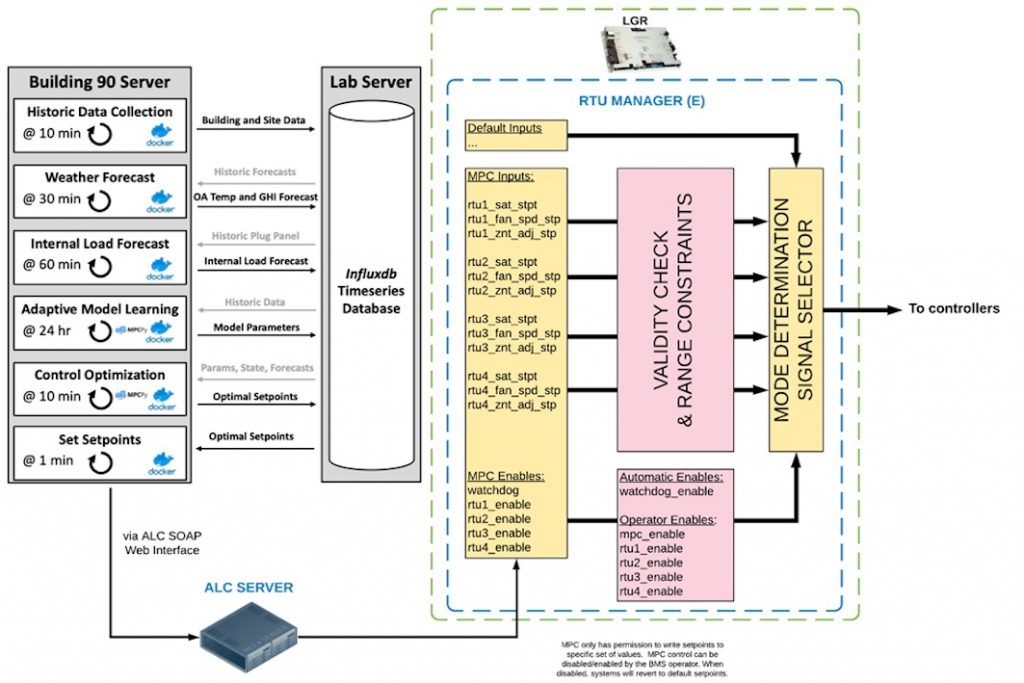
Heating and cooling are provided to the offices by an underfloor air distribution (UFAD) system. The system uses four roof-top units (RTUs) located on the roof with water-cooled direct expansion (DX) coils to supply cool air to the underfloor plenums. HVAC systems are controlled by an Automated Logic (ALC) WebCTRL building management system (BMS) with an extensive array of sensors. BMS sensors and controllers are networked to a National Energy Research Scientific Computing (NERSC) network firewall-protected server hosted within the Building 59 computer room facility. Read access to the ALC BMS logic and data trends is provided through a web-hosted graphical user interface (GUI).
During the data collection periods (2018–2020), two control modes were applied: conventional rule-based control (RBC) and model predictive control (MPC). RBC used a predetermined zone temperature setback schedule (second-floor office, Saturdays) to select the temperature setpoint of each under-floor terminal (UFT) as well as the minimum outside air flow damper position. In late summer 2020, more functions were introduced to the RBC control, including a fresh air flow rate setpoint and a smoke mitigation mode for the wildfire season. MPC adopted an optimization-based approach to determine the optimal setpoints for RTU supply air temperature and fan speed based on the current states and predicted disturbances. MPC mode was on in the fall and winter of 2020.
The building is divided into 57 thermal zones. Thermal zones with exterior walls and windows are classified as exterior zones; others are classified as interior zones. The temperatures of exterior zones are measured by the wall-mounted sensors installed within each zone served by a UFT as part of the building automation system (BAS). The temperatures of interior zones are measured by 16 sensors that were added by the research team at the desk level, which are built with Raspberry Pi Zero W and DS18B20 Digital Temperature Sensors. These temperature sensors are located as close as possible to where occupants stay, for instance, at their workstations. Camera-based sensors manufactured by TRAF-SYS were deployed at the six entrances/exits of the southern wing of the building. Additionally, the total number of connected devices at each Wi-Fi access point (AP) were collected and aggregated at the floor level based on the location of each AP. The Wi-Fi connection counts could serve as a proxy variable of occupant counts. For more information, the inferring methodology was illustrated in the work done by Wang et al. (2019).
The final dataset is composed of the cleaned time-series operation data, the Brick model representing the metadata of the data measurements, and the JSON file representing the metadata of the dataset.
The dataset is hosted on the Dryad website.
ADDITIONAL INFORMATION
The dataset is hosted at Dryad website: https://doi.org/10.7941/D1N33Q.
The Python code for detecting and filling the data gaps, as well as for modifying outlier values, is available at the dataset’s GitHub page: https://github.com/LBNL-ETA/Data-Cleaning.
N. Luo, Z. Wang, D. Blum, C. Weyandt, N. Bourassa, M.A. Piette, T. Hong. (2022). A three-year dataset supporting research on building energy management and occupancy analytics. Scientific Data, 9(1), 156.
N. Luo, T. Hong. Energy and occupancy analytics to improve understanding and efficiency of building operations – A case study of an office building in Northern California. International COBEE Conference, Montreal, July 2022.
D. Blum, Z. Wang, C. Weyandt, D. Kim, M. Wetter, T. Hong, M.A. Piette. (2022). Field Demonstration and Implementation Analysis of Model Predictive Control in an Office HVAC System. Applied Energy, 318, 119104.
For more information on the Case Study
Contact Person:
Dr Tianzhen Hong